THE RECEIPTS · SEP 25
The Receipts
Most weather sites tell you they are accurate. This one shows the marks. Every forecast the rock publishes is written down, waited on, and graded against what actually happened. 14,777 graded calls so far, and the numbers below are printed whether they flatter the rock or not.

A correction, published the way we publish everything. On August 19 we found and fixed a grading bug: the day-ahead scorecard had been matching most predictions against the previous day's weather, not the day each prediction was actually for. Every affected row was regraded in place against its true date, and the originals are preserved. The models scored better than this page used to say, and the numbers on this page are the honest, repaired record.
Was it wet or dry, by how far ahead we called it
Temperature, over the same calls: 1h out by 2.1F, 3h out by 2.1F, 6h out by 2.1F, 12h out by 2.1F, 24h out by 2.1F, 48h out by 2.5F.
Day ahead, model by model
Each model publishes a chance of rain for tomorrow. This is how often a claim above fifty percent matched a day that actually got wet, and how often one below it matched a day that stayed dry. Graded through 2026-09-25.
| Model | Right | Days graded |
|---|---|---|
| GFS | 81 percent | 2744 |
| NDFD | 78 percent | 639 |
| ECMWF | 69 percent | 2744 |
| NBM | 68 percent | 2411 |
Is the confidence honest
Hit rate says whether the rock was right. This says whether it meant it. When the forecast claims a given chance of rain, that share of those hours should actually turn out wet.
| The rock said | It actually rained | Hours |
|---|---|---|
| 0 to 19 percent | 1 percent of them | 5147 |
| 20 to 39 percent | 16 percent of them | 530 |
| 40 to 59 percent | 24 percent of them | 263 |
| 60 to 79 percent | 47 percent of them | 176 |
| 80 to 99 percent | 70 percent of them | 115 |
Updated 2026-09-25. Every figure here was graded against what actually happened, from an independent source, never against our own forecast. Nothing on this page is filtered, weighted or rounded in the rock's favour. Where a sample is thin it says so, because a flattering number from twenty readings is not a finding.
More from the Journal
 THE WEATHER BEAT
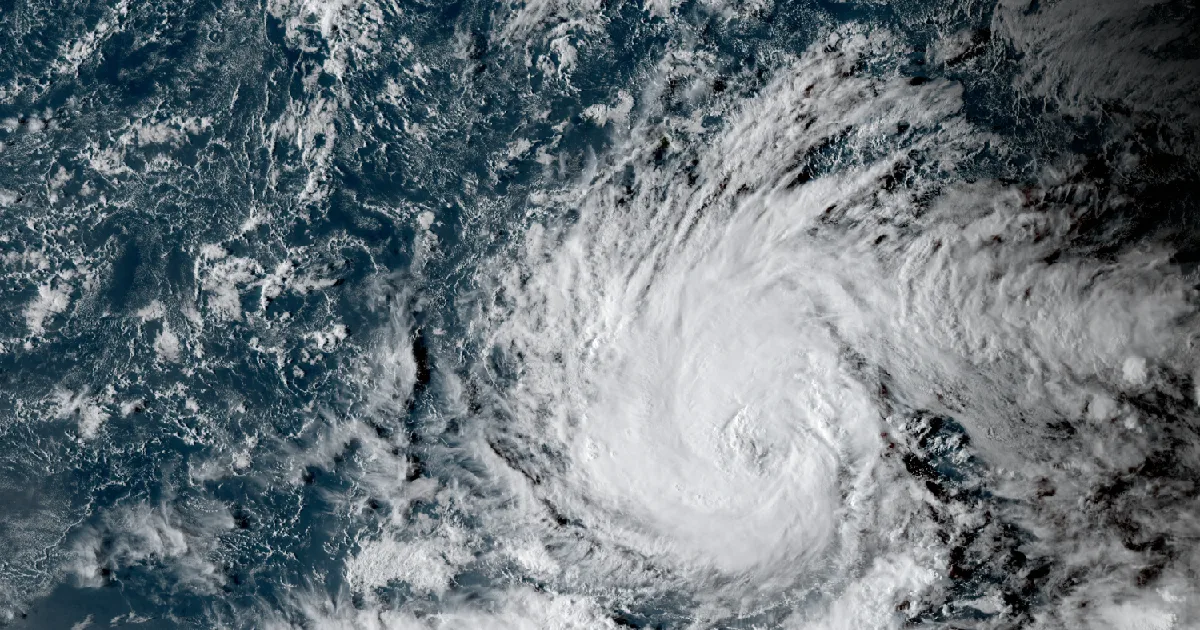
Nolo became a hurricane Thursday evening, and the Big Island carries a warning and a watch at the same time
SEP 25
THE WEATHER BEAT
Nolo became a hurricane Thursday evening, and the Big Island carries a warning and a watch at the same time
SEP 25
 THE WEATHER BEAT
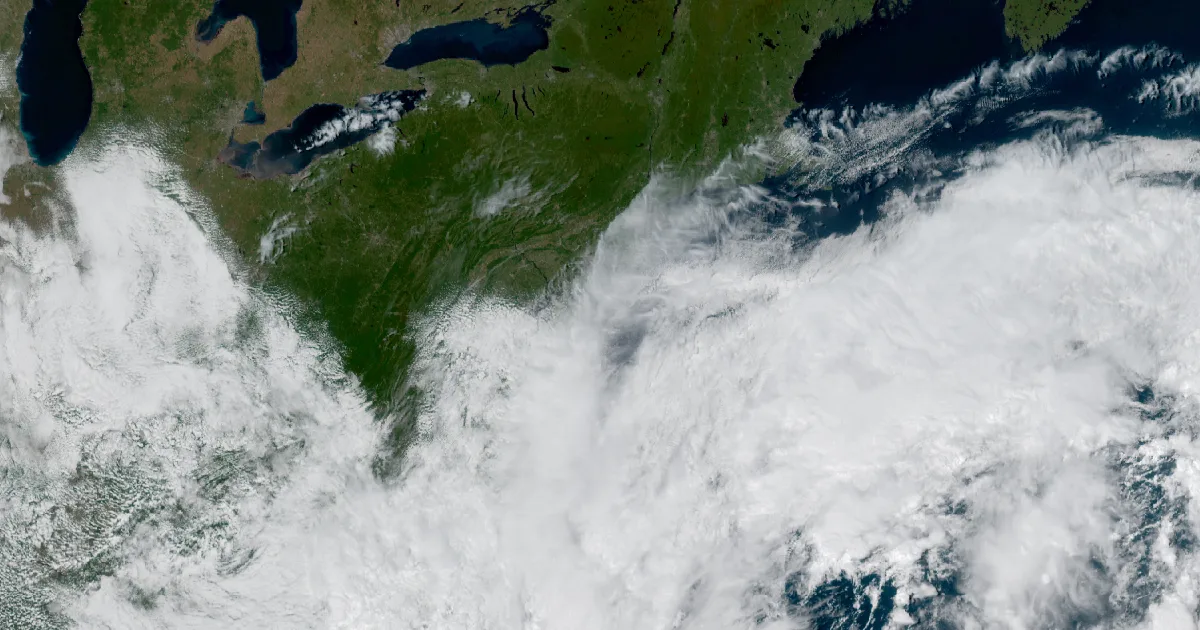
The week's coastal low became a nor'easter in the discussions, and Boston wrote the first High Wind Warning
SEP 24
THE WEATHER BEAT
The week's coastal low became a nor'easter in the discussions, and Boston wrote the first High Wind Warning
SEP 24
 EXPLAINERS
Why Is the Sky Blue?
AUG 20
EXPLAINERS
Why Is the Sky Blue?
AUG 20
Follow the Journal: RSS · get it by email